Ch. 11: Information Visualization for Text Analysis
As discussed in the previous chapter, visualization when applied to text seems to be most effective for specialists doing data analysis. Although this is an exciting field, it is not what most people think of when one talks about search interfaces. Unfortunately, some researchers working on visualization of text conflate search tasks with data analysis tasks. For example, Veerasamy and Heikes, 1997 critique one interface for making it “more difficult than in our tool to gain an overall picture of the query word distribution for a whole set of documents in one glance.” It is unclear why a searcher would want to see such a distribution, even though such a view may be of great interest to a computational linguist.

This chapter describes ideas that have been put forward for understanding the contents of text collections from a more analytical point of view. The first section discusses applications in the field of Text Mining, which usually involve visualizing connections among entities within and across documents. The next section discusses methods for visualization occurrences of words or phrases within documents, in what have classically been called concordances. The final section discusses various attempts to visualize relationships between words in their usage in language and in lexical ontologies.
11.1: Visualization for Text Mining
There is great interest in the field of text mining, which can be defined as the discovery by computer of new, previously unknown information, by automatically extracting information from different written resources (Hearst, 1999a, Feldman and Sanger, 2006).
One of the most common strategies used in text mining is to identify important entities within the text and attempt to show connections among those entities. For example, Figure 11.1 shows a screenshot from the TAKMI text mining system (Nasukawa and Nagano, 2001, Uramoto et al., 2004), in which text from call center complaints were analyzed to help staff members determine which problems with a product receive increasing numbers of complaints over time. The interface shows the distribution of entity mentions over time, using the brushing-and-linking technique to connect selected topics to bar charts. The authors state that this system was used enthusiastically by call center staff (a more advanced version of this interface is now part of IBM's OmniFind Analytics product). Other dashboard-like text analysis tools have been developed in this vein, such as FeatureLens (Don et al., 2007).

Similarly, the Jigsaw system (Gorg et al., 2007) was designed to allow intelligence analysts to examine relationships among entities mentioned in a document collection and phone logs. Among other things, the display included a sortable-column view that shows multiple reorderable lists of entities (see Figure 11.2) and a node-and-link diagram displaying connections between entities.
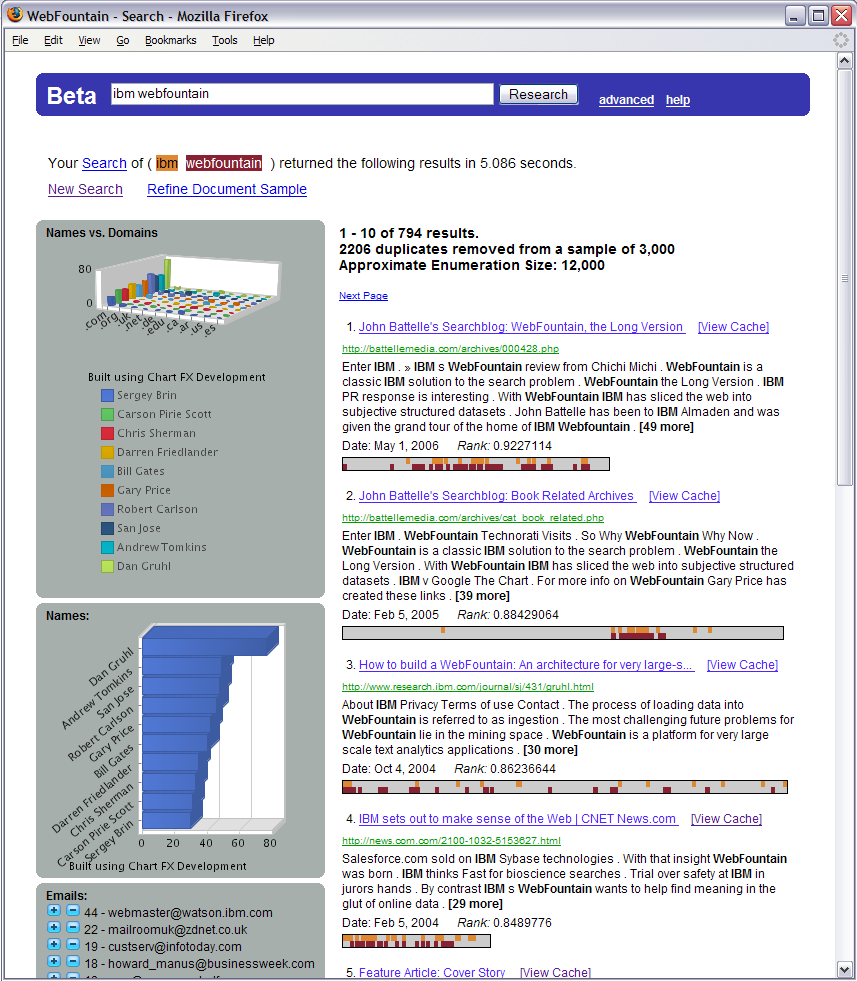
The BETA system, part of the IBM Web Fountain project (Meredith and Pieper, 2006), also had the goal of facilitating exploration of data within dimensions automatically extracted from text. Figure 11.3 shows the results of a query on ibm webfountain. The search results list on the right hand side was augmented with a TileBars display (Hearst, 1995) showing the location of term hits in color and the relative lengths of the documents. Along the left hand side was shown a 3D bar chart of occurrences of entity names plotted against Web domains, as well as a sorted bar chart showing frequency of entity names across domains. Entity occurrence information can also be plotted across time in this interface. The system was not formally evaluated.
The TRIST information “triage” system (Jonker et al., 2005, Proulx et al., 2006) attempted to address many of the deficiencies of standard search for information analysts' tasks. Search results were represented as document icons; thousands of documents can be viewed in one display, and the system supports multiple linked dimensions that allow for finding characteristics and correlations among the documents (see Figure 11.4).

(a)

(b)
TRIST used document icons, in combination with visual grouping, to allow the analyst to compare and contrast the documents that were returned for different queries. Figure 11.4b shows an example of an epidemiological analysis of avian flu, contrasting the results of three related queries ( Avian Flu, Bird Flu, and H5N1 outbreak). Icon color was used to show the user which documents they have already viewed, and icon size and shape show the length and type of the document, respectively. TRIST also used entity extraction to identify the people, places, and organizations that occur within the retrieved documents. Entities of interest could be dragged to the workspace below the search results, while retaining the links to the search results from which they came.
The document icons could also be organized using Country and Time dimensions, to produce a quick trend analysis of where and when the disease has occurred, without opening any of the search result documents. The document icons were linked across the different views, so, for example, selecting all the documents from the Nigeria dimension shows the distribution of the dates mentioned in those documents (see Figure 11.4a). The documents could also be grouped by clustering or automated categorization; in Figure 11.4b the animals category suggests that cats, not just birds, are mentioned, which may be an interesting avenue to explore given the suspicions about the role of birds in this scenario. The tool also allowed the entities extracted from the documents to be organized according to automatically detected relations, such as work relation (works with, subordinate of) and family relation.
TRIST, when used along with sensemaking tools (see Chapter 7) seems to be an effective tool, as it enabled its designers to win the IEEE Visual Analytics Science and Technology (VAST) contest (Grinstein et al., 2006) for two years running. However, because each system was tested by its implementors, the TRIST system may have performed better in part because its designers had training in intelligence analysis while most other participants did not.
11.2: Visualizing Document Concordances and Word Frequencies

In the field of literature analysis it is commonplace to analyze a text or a collection of texts by extracting a concordance : an alphabetical index of all the words in a text, showing those words in the contexts in which they appear. The standard way to view the concordance is to place the word of interest in the center of the view with “gutters” on either side, and then sort the surrounding text in some way (see Figure 11.5).


This is similar to the notion of showing keywords in context (KWIC) summaries for search results, as discussed in Chapter 5. The difference is that concordance analysis is intended for understanding properties of language or for analyzing the structure and content of a document for its own sake, rather than for search. This section discusses a number of visualizations of this type.
The SeeSoft visualization (Eick, 1994) represented text in a manner resembling columns of newspaper text, with one “line” of text on each horizontal line of the strip (see Figure 11.6.) The representation is compact and aesthetically pleasing. Graphics are used to abstract away the details, providing an overview showing the amount and shape of the text. Color highlighting was used to pick out various attributes, such as where a particular word appears in the text. Details of a smaller portion of the display could be viewed via a pop-up window; the overview shows more of the text but in less detail.
SeeSoft was originally designed for software development, in which a line of text is a meaningful unit of information. The visualization showed attributes relevant to the programming domain, such as which lines of code were modified by which programmer, how often particular lines have been modified, and how many days have elapsed since the lines were last modified. The SeeSoft developers then experimented with applying this idea to the display of text, although this was not integrated into an information access system. Color highlighting was used to show which characters appear where in a book of fiction, and which passages of the Bible contain references to particular people and items. Note that an entire line is used to represent a single word such as a character's name (even though this might obscure a tightly interwoven conversation between two characters).
The TextArc visualization (Paley, 2002) is similar to SeeSoft, but arranged the lines of text in a spiral and placed frequently occurring words within the center of the spiral. Selecting one of the central words drew lines radiating out to connect to every line of text that contain that word (see Figure 11.7). Clicking on the word showed the contexts in which it occurred within the document, so it acts as a kind of visual concordance tool. In a similar vein, the Docuburst visualization (Collins, 2006) used a coxcomb-type radial visualization to show words from a document in terms of their hypernym (ISA) links (see Figure 11.8). And the Word Tree (Wattenberg and Viegas, 2008) shows a visualization of a document concordance, allowing the user to view which words and phrases commonly precede or follow a given word, thus showing the contexts in which the words appear (see Figure 11.9).


Some Web sites have used tag clouds as a way to show the frequency of term occurrences, but without the context that concordance views provide. Figure 11.10 shows an example from the Many Eyes social visualization Web site (Viégas et al., 2007). In this case, the source of the words is the text of three early paragraphs from Chapter 10. However, usability results (Rivadeneira et al., 2007, Halvey and Keane, 2007) suggest that tag clouds are inferior to straightforward lists both for finding individual items and for getting the gist of a site, and are more effective as a signaller of social activity (Hearst and Rosner, 2008). Figure 11.11 is an example of an more aesthetically-pleasing variation of these “word clouds”, called a Wordle; usability studies have not been conducted on this representation.
Standard data graphics can be an effective tool for understanding frequencies of usage of terms within documents. Figure 11.12 from The New York Times shows an analysis of uses of different words across the texts of the U.S. president's annual “State of the Union” address, showing which terms are used how often as the national situation changes. On the left, a SeeSoft-style visualization of the text is linked to the search box, and a table showing frequency of term usage graphically across time is shown on the right. Note the use of time as a meaningful dimension for an analysis task such as this one, showing how topics ebb and flow as the concerns of the day change. The diagram is useful for seeing gaps in the data -- for example, for seeing which terms do not occur frequently as well as for which do.

As discussed in Chapter 10, nominal or categorical variables are difficult to display graphically because they have no inherent ordering. The categorical nature of text, and its very high dimensionality, make it very challenging to display graphically. However, certain carefully designed tools manage to work within these constraints successfully. For example, The NameVoyager visualization (Wattenberg and Kriss, 2006) shows frequencies of baby names for U.S. children across time. The user types in the first few letters of a name, and a stacked bar graph is shown in which all matching names are shown, in alphabetical order, with the frequency for a given year determining how much space lies between the line for that name and the name below it. The naming frequency changes over time, producing an impression of undulating waves.
It appears from these graphs that fashion in naming of children tends to be correlated with the way names sound (Wattenberg and Kriss, 2006) ; it may be that naming is influenced by a psychological principle called phonesthesia, in which vocal sounds suggest hints of meaning. For example, users of this tool discovered that names beginning with vowels were popular at the end of the 19th century, dropped precipitiously in midcentury, and then grew popular again starting in the 1990s (see Figure 11.13). If there were no phonesthetic effects, strong patterns like this would probably not appear in the data.
The ThemeRiver visualization uses a similar view to show frequencies of mentions of topics in text over time (Havre et al., 2002). Despite the popularity of the NameVoyager interface, stacked bar graphs are problematic because the shape of any given line is determined in part by the shapes of the lines below it, thus potentially misleading the interpretation of the graph's values.

(a)

(b)
Numerous visualizations have been proposed for showing relationships among words, both within documents and within lexical ontologies. One strategy is to show words in a 2D layout, as done in the Word Space (Brandes et al., 2006) visualization described in Chapter 10. As a more readable alternative, several systems use an animated nodes-and-links layout to progressively and dynamically show relationships among words, as seen in Visual WordNet, seen above in Figure 10.8.
11.3: Visualizing Literature and Citation Relationships
Closely related to both text mining and text concordance analysis is the broader field of literary analysis and citation analysis. Hundreds of research papers have been written analyzing how the authors of articles in the scientific literature refer to or cite one another. This information is used to assess the importance of the authors, the papers, and the topics in the field, and how these measures change over time. (Document citation patterns are also used in Web ranking algorithms to help identify high quality pages.) As discussed above, relationships among nominal categories are easier to visualize than those nominal categories themselves, and nodes-and-links graphs are the most popular for showing connections between documents and authors. One of the more innovative views of such graphs was created by Small, 1999 and emphasizes relations among scientific disciplines (see Figure 11.14).

Some more recent approaches have moved away from nodes-and-links in order to break the interesting relationships into pieces and show their connections via brushing-and-linking interactions. As one example, Shneiderman and Aris, 2006 show citations between court cases by breaking the nodes up into different meaningful regions and showing the connections between or within the regions. Users are given control of which links' connections are shown at any given time (see Figure 11.15). The PaperLens visualization (Lee et al., 2005) analyzes the papers that have appeared within an academic conference over eight years (see Figure 11.16). The data is broken into different views including year by year top 10 cited papers/authors, popularity of topic by year, degrees of separation among selected authors, as well as an alphabetical list of all authors and their citation frequency within the collection. Brushing and linking is used heavily; selecting a paper or author in one view shows where it appears in the other views. Even more elaborate visualizations of citation patterns have been developed, such as the Butterfly visualization for asynchronously downloading documents that have been cited by other documents (Mackinlay et al., 1995a).


Another topic within the domain of literary analysis is the problem of author identification; Keim and Oelke, 2007 took standard stylistics statistics and mapped them into a visual display reminiscent of TileBars. Plaisant et al., 2006 used visualization to try to help literary scholars understand patterns in an author's work.
11.4: Conclusions
Visualization is a promising tool for the analysis and understanding of text collections, including semi-structured text as found in citation collections, and for applications such as literary analysis. Although not shown in this chapter, visualization has also been applied to online conversations and other forms of social interaction which have textual components. With the advent of social visualization Web sites like IBM's manyeyes.com, and other tools that continue to make visualization generally accessible to users who are not programmers, it is likely that the use of visualization for analysis of text will only continue to grow in popularity.